
AeroVolt Energy
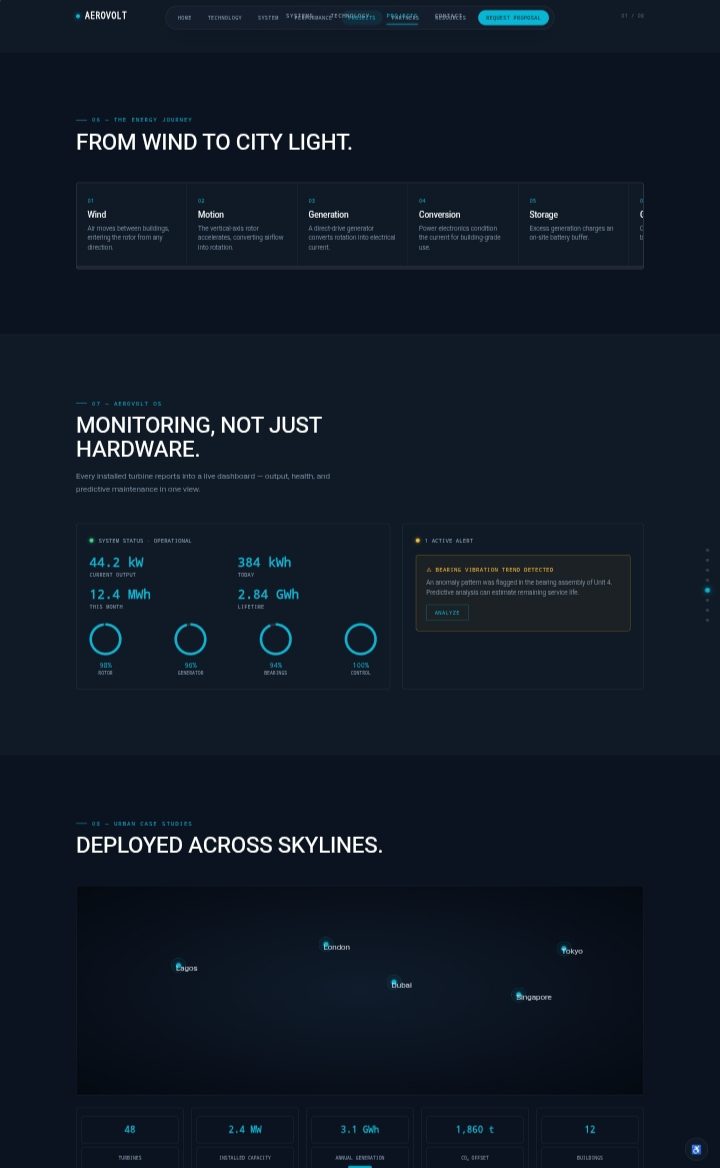
An interactive clean-energy concept website combining technical storytelling, turbine visualization, simulated wind-performance data, engineering specifications and an immersive product experience.
Context
AeroVolt Energy is a concept site for a vertical-axis wind-turbine company built for dense urban environments — the kind of hardware meant for rooftops and tight city sites where traditional horizontal turbines don't fit. The site's job is to make an unfamiliar engineering product feel understandable at a glance, then rewarding to explore in depth.
The Challenge
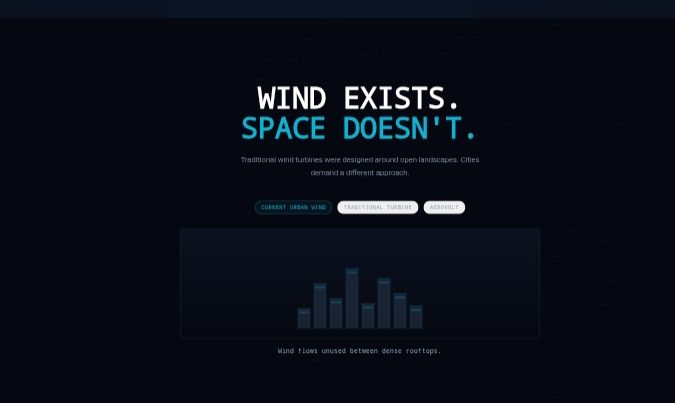
Engineering products are hard to sell online: the audience ranges from curious visitors to technical partners who want real specifications. The challenge was designing one interface that works for both — an emotional "power above the city" opening, backed by a genuinely interactive engineering model underneath.
Objective
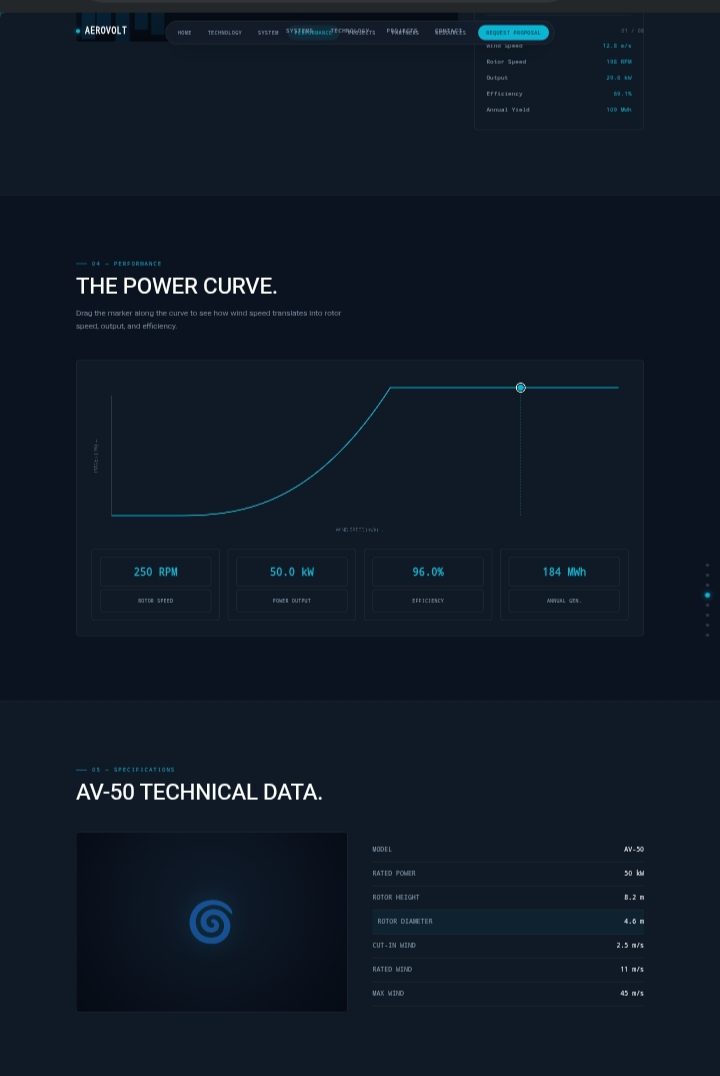
Present renewable-energy performance as verifiable data rather than environmental sentiment, for an audience of engineers and procurement teams.
Approach
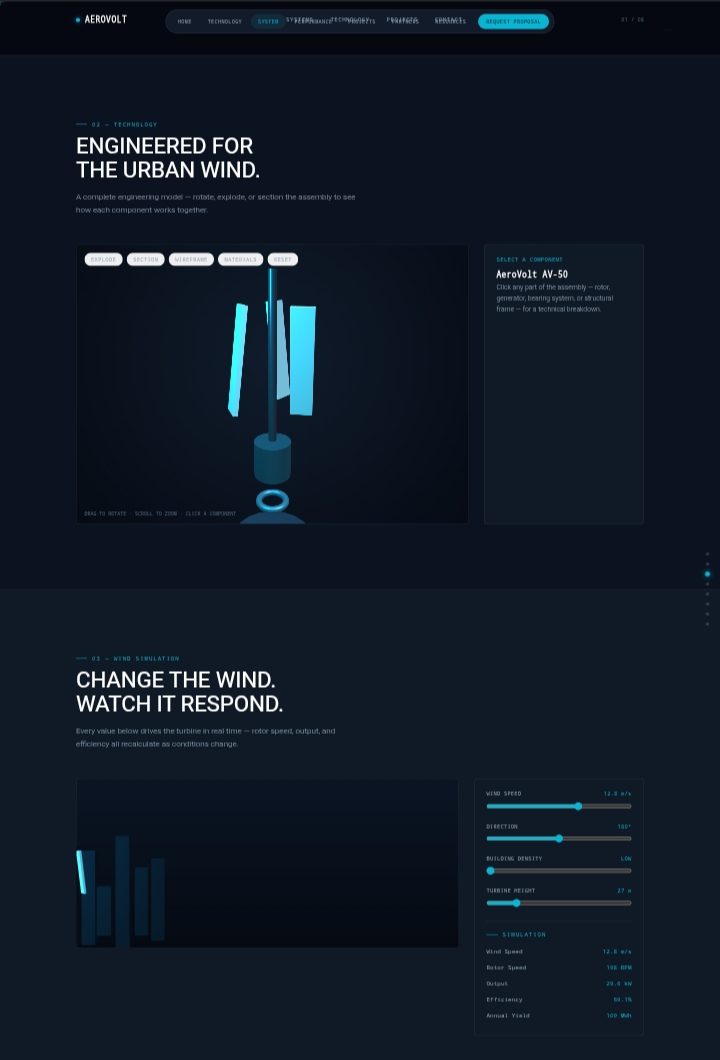
I centered the experience on a 3D turbine assembly the visitor can rotate, explode, section and inspect component-by-component, paired with a live wind-simulation panel where adjusting wind speed, direction and building density recalculates rotor speed, power output and efficiency in real time.
Design Direction
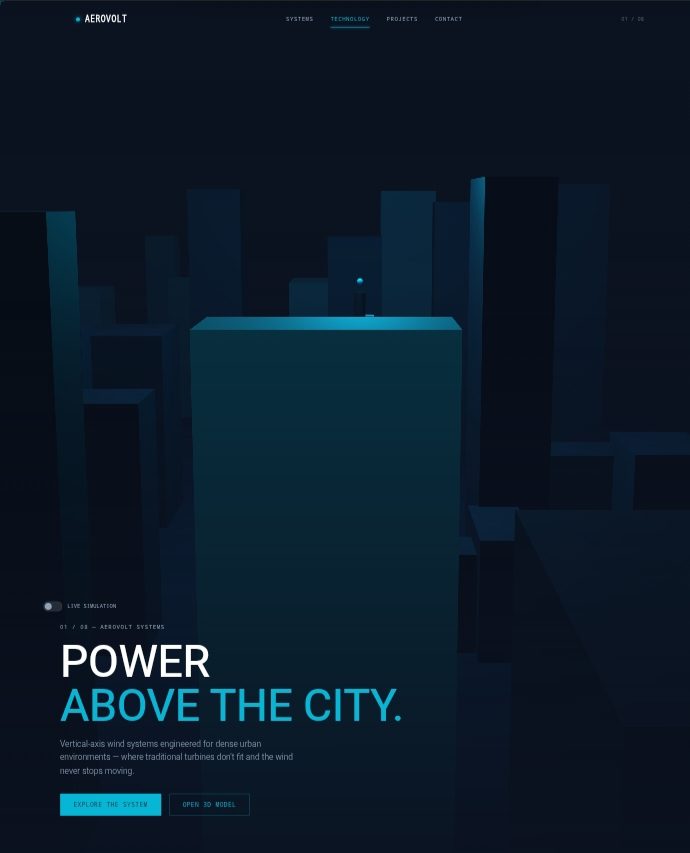
A dark navy-to-teal palette evoking dusk skylines and moving air, with a clean technical typeface for data readouts. City-silhouette illustration in the hero ties the "urban wind" positioning directly into the first thing a visitor sees.
Technical Implementation
Built with semantic HTML5, modular CSS and vanilla JavaScript, including a canvas/SVG-driven 3D-style turbine view with explode, section, wireframe and materials toggle states, and a simulation panel that recalculates linked output values as sliders change.
Outcome
A polished interactive frontend concept that turns a technical clean-energy product into an explorable experience — demonstrating how simulated engineering data, 3D-style visualization and dashboard UI can work together without overwhelming a first-time visitor.
Lesson
Technical audiences forgive plain design faster than they forgive vague numbers — precision is the aesthetic in energy interfaces.